AlphaDrift
Turns macro data and market signals into actionable sector ETF guidance — and what it means for stocks you already own.
AlphaDrift identifies industry groups where short-term price momentum has diverged from long-term macro outlook. Drawing on Fed data, analyst ratings, and expert news sentiment — so you can buy the dip with conviction, and avoid catching falling knives.

Macro outlook from analyst ratings, structural conditions, and news sentiment.
What prices are moving today, and broader market sentiment.
Breakdown of movements by global and sector performance.
Dominant themes driving the market.
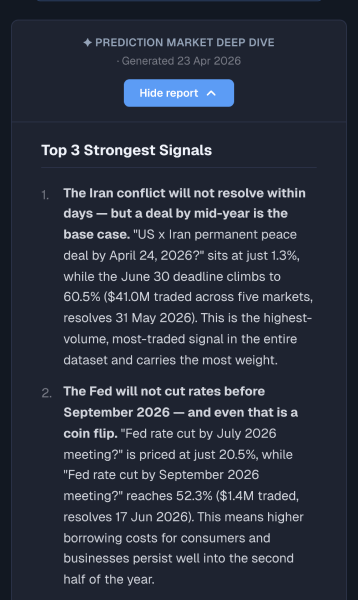
Probabilities related to those themes, sourced from Polymarket.
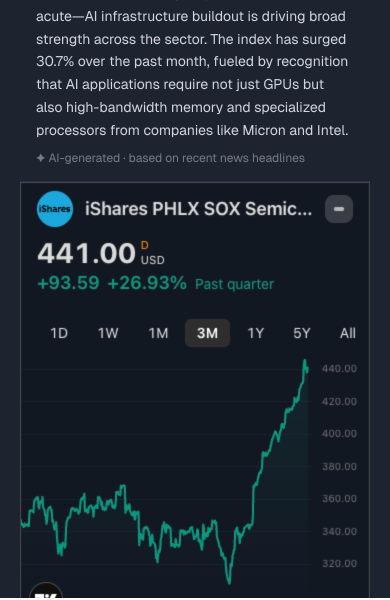
Why stocks moved, with real-time charts.
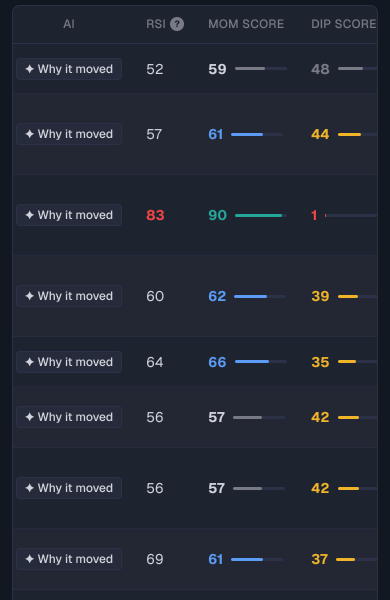
See where momentum diverges from recent price dips.
AI-driven deep-dive reports on prediction markets and economic signals.
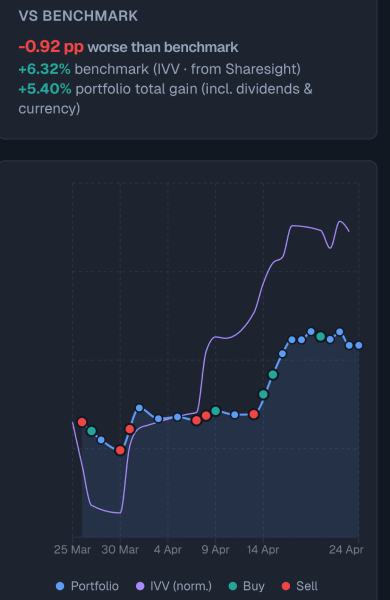
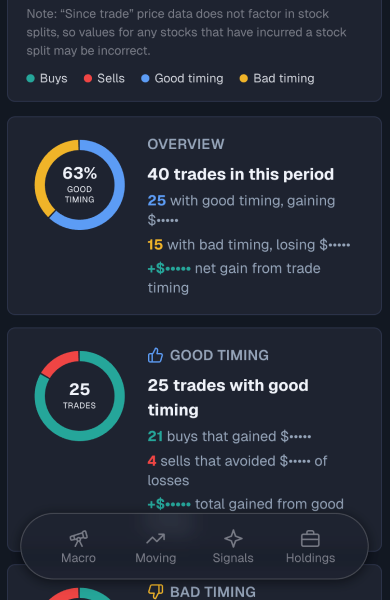
Track your trades over time.
Analysis on the timing of your trades.
How your stocks performed after your entries and exits.
What does AlphaDrift do?
Markets regularly overprice or underprice entire industry sectors based on short-term narratives. AlphaDrift tracks where the long-term macro outlook is heading independently of recent price movements — then surfaces the gap as an actionable trade signal.
How it works.
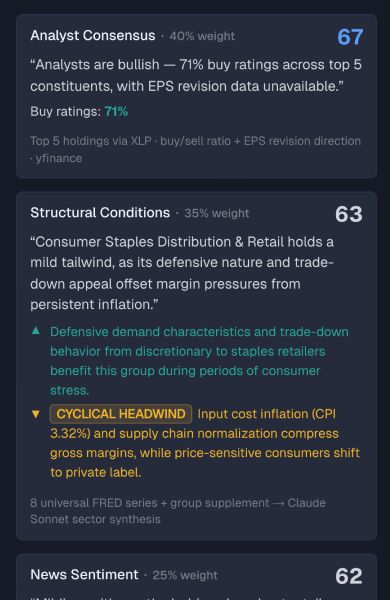
Macro Outlook
Every morning, AlphaDrift scores all 25 GICS Industry Groups on a 0–100 scale — measuring where each group's macro outlook is heading over the next 6–12 months. This score is completely price-independent. It measures where the macro outlook is heading, not where price has been. Recent price performance is deliberately excluded — that's handled in the next step.
The score is composed of three independently weighted signals:
For each of the 25 GICS Industry Groups, AlphaDrift finds the most targeted ETF for that group, fetches its top 5 holdings by weight, and pulls the current professional analyst ratings for each of those five stocks — buy, hold, or sell. Those ratings are averaged into a single consensus score, reflecting what full-time sector analysts currently expect for earnings and revenue over the next 12 months.
- Look up SOXX — the designated semiconductor ETF in the database
- Fetch SOXX's top 5 holdings: NVDA, AMD, MU, AMAT, AVGO
- Pull analyst buy / hold / sell ratings for each of those 5 stocks
- Average them — e.g. 86% buy ratings → consensus score: 70 out of 100 for Semiconductors
“Analysts are broadly bullish — 78% buy ratings across top 5 constituents, with EPS estimates revised up 6% over the past 3 months.”
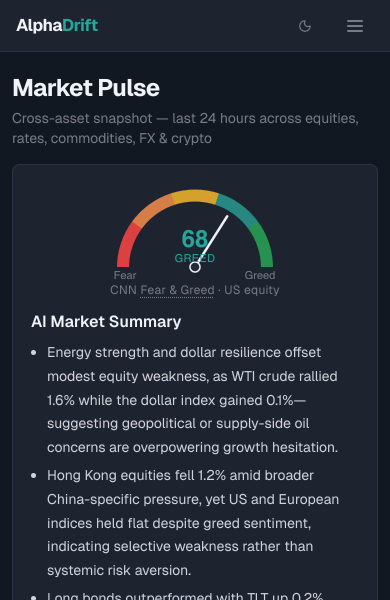
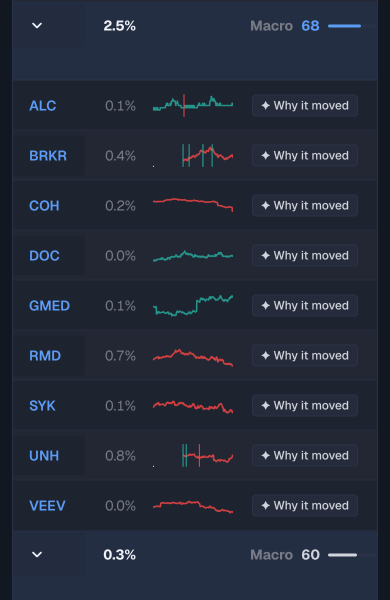
What's Moving Now
Tracks which industry groups have been going up or down — completely independently of the macro scores above. Pure price signal: what has the market actually been doing to each group?
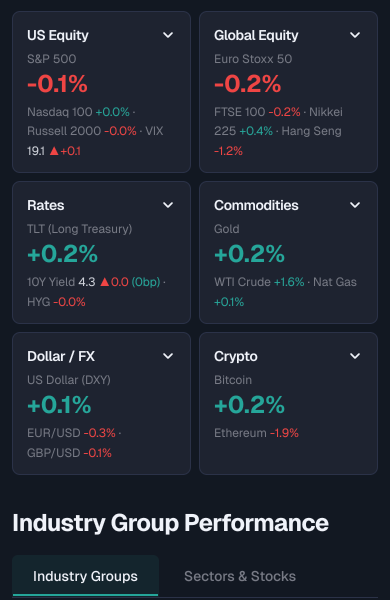
Price performance is displayed across three levels of granularity that you can drill into: broad market sectors, the 25 GICS Industry Groups, and individual industries within each group. Each level gives a progressively sharper view of where capital is flowing.
Toggle between timeframes to see whether momentum is building or reversing. A group that's up 8% on the month but flat on the week may be running out of steam. Each group links to an interactive price chart for deeper inspection.
Each group is tracked via its most targeted ETF — or, where no faithful ETF exists, its most representative stock — so the signal reflects that specific slice of the market rather than being diluted across multiple themes.
For groups showing an unusual single-day move — significantly above their recent average daily range — an AI model generates a one-line explanation of the likely catalyst, drawn from news from the preceding 48 hours.
When two groups within the same sector diverge significantly — say Software up 2% while Semiconductors are down 3% within the same IT sector — a rotation callout surfaces this explicitly.
Opportunity Signal
When the macro outlook and recent price momentum diverge, that gap is the signal. Steps 1 and 2 are combined here to surface the strongest buy and sell candidates across all 25 groups.
Macro outlook is strong but price has been weak. The market is underpricing the long-term view — a potential entry opportunity.
Price has run up but macro outlook is weak. The market is overpricing the near-term narrative — a potential exit or avoid signal.
All 25 GICS Industry Groups are shown in a single sortable table. The top 5 buy opportunities are highlighted in green; the top 5 sell or avoid signals in red. Sort by macro score, momentum, or the combined opportunity score to view the landscape from different angles.
For each top signal, an AI model writes a plain-language explanation of the divergence — the macro backdrop, the recent price behaviour, and what the opportunity or risk actually is.
“Semiconductors carry a strong macro score driven by AI infrastructure demand and declining rates, but the group has underperformed by 9% over the past month on export control fears. The structural case hasn't changed — this looks like an entry opportunity on a short-term narrative overhang.”
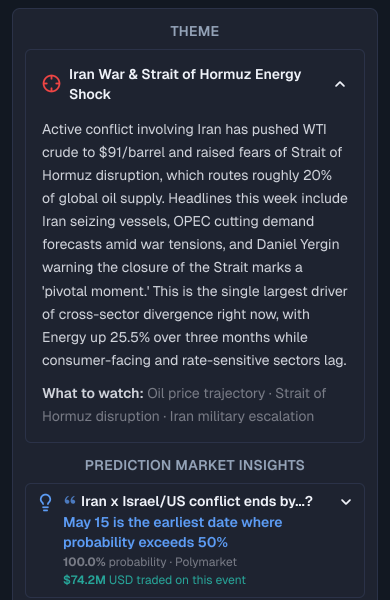
Prediction Markets
AlphaDrift uses an AI model to extract the dominant economic themes from the current macro landscape — rate trajectories, trade policy shifts, commodity supply disruptions, and similar forces shaping markets over the next 6–12 months. For each theme, it maps out plausible scenarios and identifies which GICS Industry Groups would benefit or suffer under each one, producing buy, caution, and avoid verdicts per sector.
To pressure-test those scenarios, the pipeline scans Polymarket — the largest prediction market — for real-money bets that map to each theme. It extracts tipping-point signals: the price, rate, or date where the crowd crosses 50% probability. These signals are surfaced alongside the scenario cards, giving you a market-derived probability check on each macro thesis.
“Markets price a >60% chance of oil staying below $110 through March but reaching $120 by June. Fed funds futures imply two rate cuts by September (72% probability). These signals support the 'soft landing' scenario — favouring rate-sensitive groups like Real Estate and Utilities.”
Your Holdings
All of the above applied directly to the stocks you own. Upload your holdings and get a clear signal — add, hold, or exit — for every position.
Paste a list of tickers (NVDA, JPM, NEE, etc.) or upload a CSV. The signals are actionable portfolio decisions — designed to answer whether each position should be added to, held, or reduced.
Each ticker is classified to its GICS Industry Group — one of the 25 groups AlphaDrift scores. NVDA → Semiconductors. JPM → Banks. NEE → Utilities. An AI model handles the classification; you review and confirm each mapping before signals are applied.
Each stock inherits its industry group's macro score and opportunity signal from Steps 1–3, weighted against the stock's own recent price behaviour:
Ready to find the divergence?
Open the dashboard to see today's macro scores across all 25 GICS Industry Groups.